Author: Le Roux Schoeman

So skarrel Kaapse hawelose

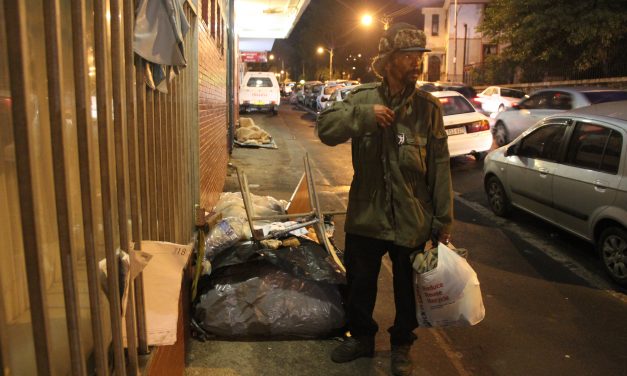
  Die Kaapse koue bring veral ontbering vir die stad se meer as 5 800 haweloses. Maar wie is dié sypadjie – bushalte – en onder-brugslapers? Hoe oud is hulle, watter strate of parke verkies hulle en wat doen hulle bedags? Die stad Kaapstad het nou begin lig werp op die skaduwêreld van die Moederstad se “straatmense” deur omvangryke nuwe data te publiseer oor wie waar skuiling soek. Klik hier vir die interaktiewe infograwie Dis nou mense soos Andrew Michael wat op ’n triestige Donderdagaand onder ’n klam kombers teen die skouer van ’n duikweg onderdeur die M3 by...

Read More

Duck stampede: An experiment with 360° video

As head of Netwerk24’s multimedia division, I’m always on the lookout for more engaging ways to tell visual stories to digital audiences. Imagine my delight when Code for South Africa director, Adi Eyal, arrived at Codebridge, where I’m attending the Code for South Africa Data-Driven Journalism Academy, with four brand new 360° cameras. VIDEO: Mini stampede – in 360° So, in tenuous solidarity with the bull running taking place in Spain this month, I headed out to a wine farm between Stellenbosch and Khayelitsha to witness Runner Ducks at full tilt – and ‘shoot’ them in 360°. While Vergenoegd’s Duck Parade is no...

Read More

Grondkopers woeker by Marikana

Groot grondkopers woeker behoorlik in Noordwes, wys nuwe grondtransaksiedata. Die “platinumprovinsie” het die meeste kere van alle provinsies grond sien hande verruil in die tydperk tussen April verlede jaar en Maart vanjaar. En Marikana, naby Rustenburg, mag dalk meer beroemd en berug wees as die simbool van arbeidsonrus ná die “Marikana-slagting” in 2012 waarin 34 mynwerkers dood is, maar dié distrik het die tweede meeste grondtransaksies van alle landboudistrikte landwyd.   Die data waaruit hierdie tendense blyk, is saamgestel deur Agri Development Solutionsen vroeër vandeesmaand op Landbou.com gepubliseer. Dit tel transaksies van grond groter as 20 hektaar en bied ’n interessante blik op waar “landbougrond” gekoop en verkoop word, asook die gemiddelde prys per hektaar wat daarvoor betaal word. Natuurlik wys die syfers nie vir ons wat nou juis op die grond groei of wat onder die oppervlak blink nie, maar die hoogste pryse per hektaar is ver van Noordwes en Gauteng af in die Wes-Kaap en KwaZulu-Natal betaal. Die data groepeer transaksies binne die betrokke “landboudistrikte” waarvan die grense die destydse landdrosdistrikte volg, in teenstelling met die hedendaagse munisipale grense. Die gemiddelde prys vir grond in die Marikana-distrik was R68 324 per hektaar, wat afsteek teen die gemiddeld van die nabygeleë Coligny se R167 352 per hektaar, en steeds ver onder die hoogste pryse landwyd is. INTERAKTIEF: Klik op die ikone op die kaart hieronder om te sien hoeveel was...

Read More

Happy never after: divorce in SA

Wedding venues might be a b$tch to book, but South Africans are also keeping the divorce court pretty busy. Now new data can help you “divorce-proof” your union a little bit, at least statistically-speaking. Happily never after Divorce in SAInfographic This visualisation was first published by Women 24 on 23 June 2016 Resources StatsSA...

Read More

Testing, testing… on failing at new things and stomach cramps

June was a wonderful month of failing at entirely new things, like scraping and cleaning data and trying to make a heatmap. And, in keeping with the Disruption Age mantra of ‘Fail Fast’, we got through it all at quite a snappy pace. The first two (cleaning, scraping) are modern endeavours that proved to be exactly as tedious as they sound, but are priceless skills to consolidate information from the various messy incarnations in which they land on your desk or inbox, into a format that allows systematic analysis and, in turn, forms the foundation for visualisations. The heatmap was, in this case, the final step serving as both trend visualisation and engagement tool for the reader to explore the data analysis by him/herself. Using cartodb, the heatmapping process is largely automated once you’re past a certain point, which to me sums up what I’ve learnt about data driven story-telling in my first month here at Code for South Africa, where I am doing a three month course in data journalism: It takes a lot of time and work to reach what, a month ago, I might have been tempted to call the beginning of a story. Example: On landbou.com, I read about a guy who had used information from the Deeds Office to create a database for all “agricultural land” traded in SA over a period of 12...

Read More

Categories

Recent Tweets